OneAquaHealth Resilience Map: Exploring Environmental Health Through Data
The OneAquaHealth Resilience Map offers an interactive way to explore how environmental conditions, ecosystem health, weather, and satellite-derived observations are connected across different locations and time periods.
Designed as a dynamic digital platform, the Resilience Map brings together environmental monitoring data, weather information, and Earth Observation indicators into a single interface. This allows users to move beyond fragmented datasets and gain a more complete understanding of environmental health in a specific area.
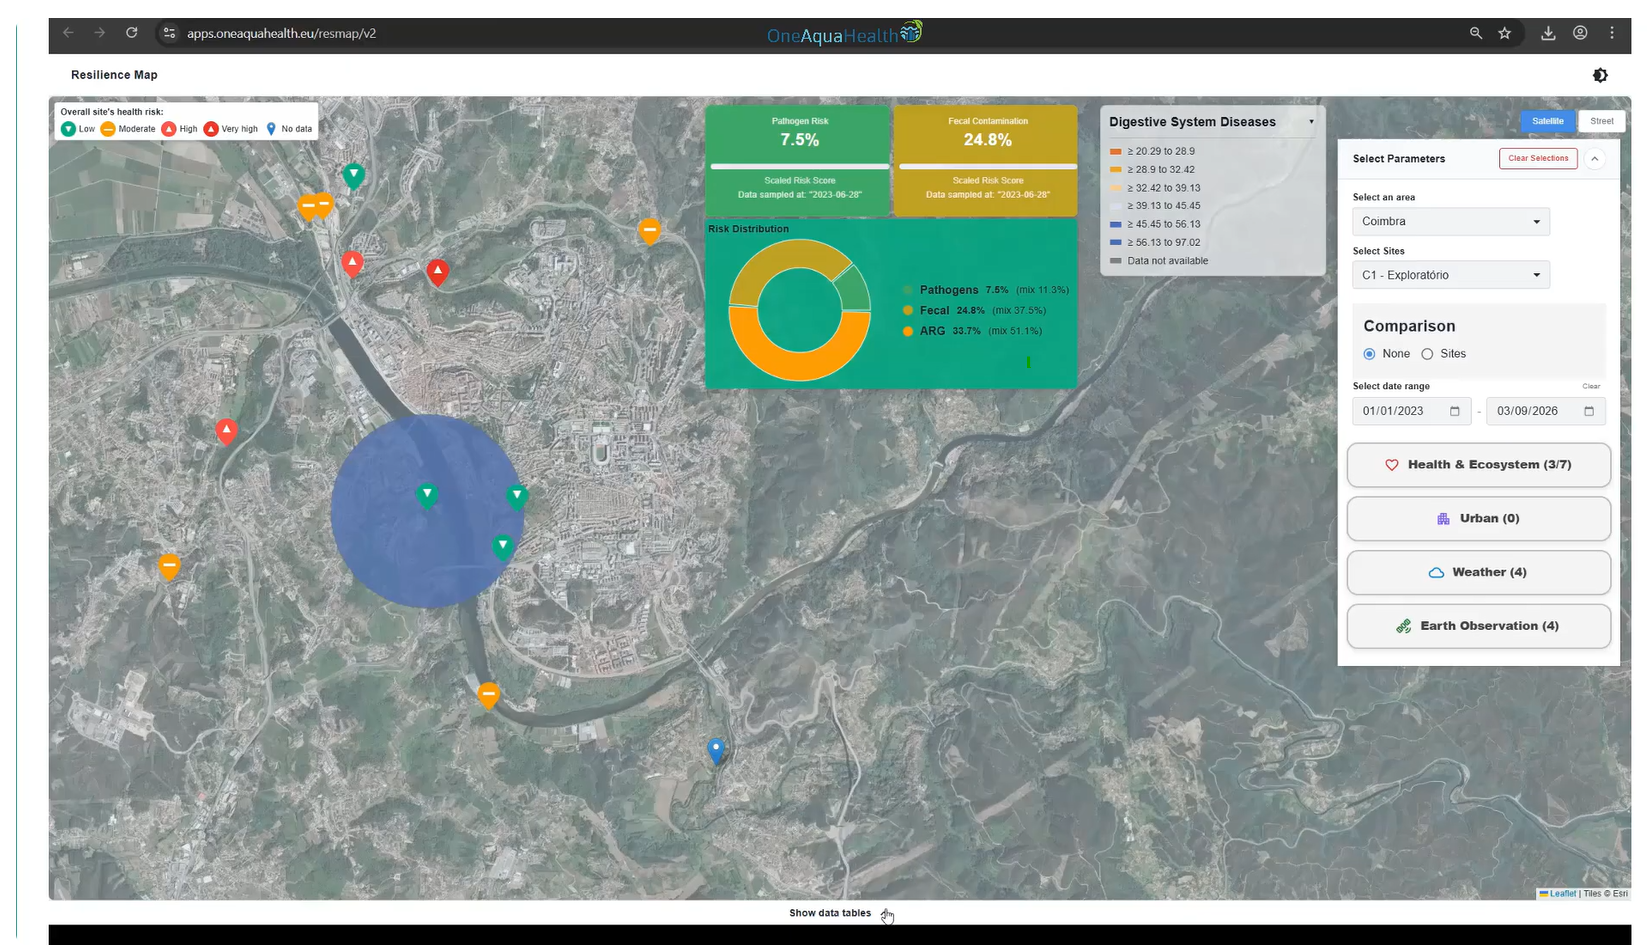
Through the platform, users can select regions and monitoring sites directly from the map or through the parameter panel, making it easy to compare locations and identify how conditions vary across space. They can also define a custom date range to focus their analysis on a specific period of interest.
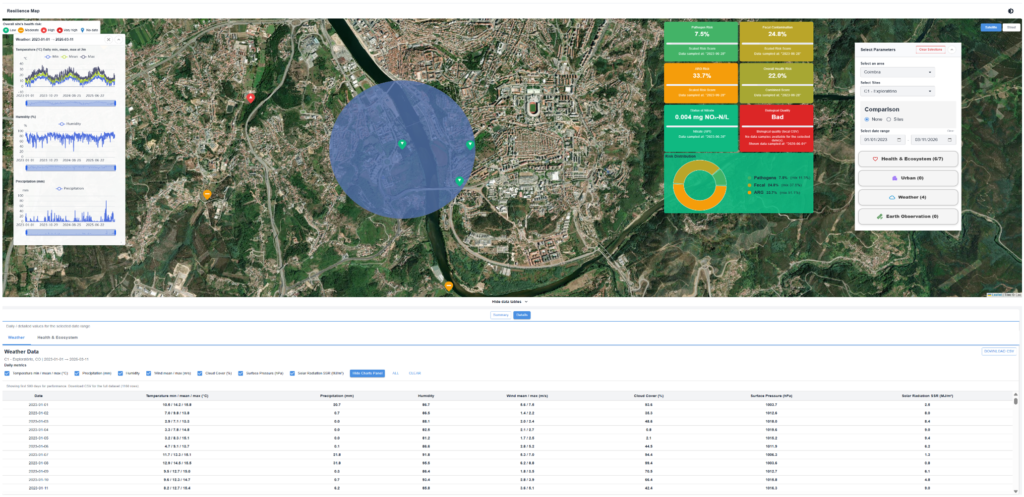
A key strength of the Resilience Map is its ability to combine multiple categories of information into a single place. In the Health & Ecosystem section, users can explore environmental health indicators, including pathogen risk, contamination levels, and ecosystem health. In the Weather section, they can explore variables such as temperature, humidity, and precipitation, helping them understand how meteorological conditions can influence environmental patterns.
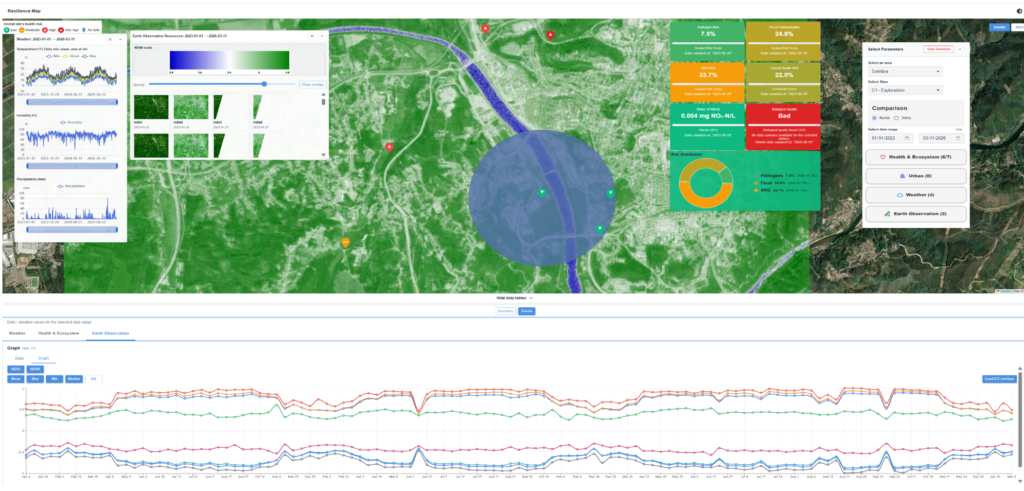
The platform also includes an Earth Observation section, where users can access satellite-derived vegetation and environmental indices. These indicators can be explored through automatically updated data tables, summaries, and detailed views, supporting both quick insights and deeper analysis. Graph visualisations make it possible to track changes over time, while statistical options such as mean, minimum, maximum, median, and standard deviation provide additional flexibility for interpretation.
Another valuable feature is the ability to load EO overlays directly onto the map, enabling users to visually examine spatial patterns and relate satellite imagery to monitoring sites. For users who want to continue their analysis offline, selected datasets can also be exported in CSV format.
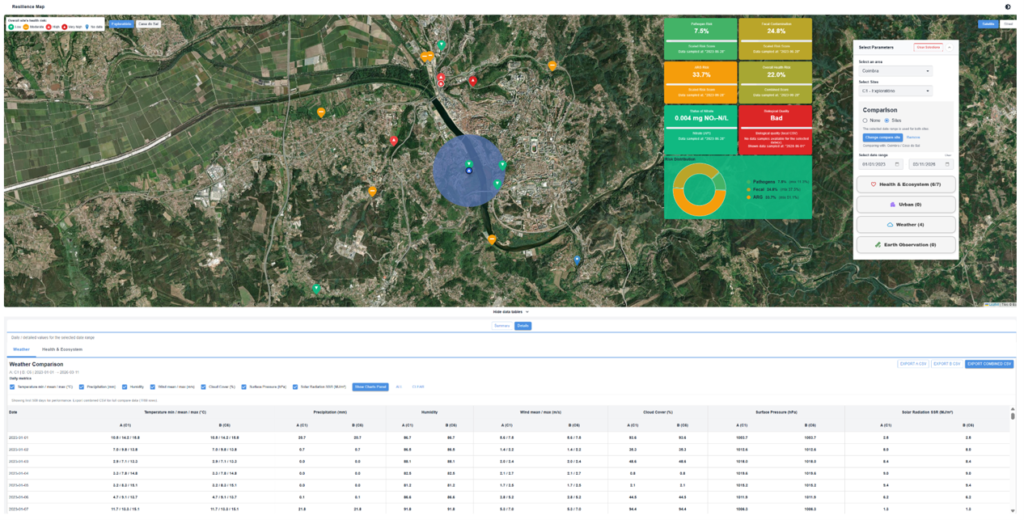
The Compare Sites function further enhances the platform by allowing users to examine two monitoring locations side by side. This makes it easier to identify differences in environmental indicators, support evidence-based assessments, and better understand local conditions.
Overall, the OneAquaHealth Resilience Map provides users with a practical, intuitive tool to explore environmental conditions, analyse ecosystem health, visualise satellite data, and compare monitoring sites across locations and time periods. By transforming complex environmental information into an accessible interactive experience, it supports more informed analysis and better decision-making.
Users can visit the OneAquaHealth Resilience Map directly at: https://apps.oneaquahealth.eu/resmap/
Additional information is provided in the following video: https://www.youtube.com/watch?v=kvE17KjCqcQ
Author(s): Iphigenia Kapsomenaki, Enora Innovation